


Short answer
You flip a multivitamin bottle and read “400 mcg folic acid” on Supplement Facts. The honest next question is whether that number is true. The Dietary Supplement Ingredient Database (DSID) is the main U.S. public dataset designed to compare supplement label amounts with laboratory measurements at the category level, not for the bottle in your hand.
DSID works differently from the testing most shoppers imagine. Nobody at NIH buys your SKU, tests your lot, and stamps pass or fail. Researchers purchase U.S. products using category-specific sampling designed to support population-level estimates (adult multivitamin/minerals, children’s MVMs, prenatal MVMs, omega-3 supplements), analyze multiple production lots in the lab, and fit a regression model. The output is a predicted category mean at each common label level: government-funded sampling and statistics, not a product scorecard.
That gap trips people up constantly. ConsumerLab buys specific products and publishes product-specific test results against its quality criteria. NSF or USP Verified tests defined batches against a standard. DSID asks: in the adult MVM studies, which used national sampling designed to represent commonly used U.S. products, when the label says 400 mcg folic acid, what did the lab find on average? One tool inspects your house. The other describes the neighborhood.
In DSID-4 adult MVM data (2011–12 purchase cohort), that neighborhood picture is uneven. Most analytes run above labeled amounts at common label levels, but direction and magnitude change by nutrient. Magnesium at a 100 mg label level estimates near 99.8% of labeled, essentially on target. Folic acid at 400 mcg estimates about 123.6% of labeled, roughly a quarter above what the panel states. Vitamin D at 1000 IU estimates about 132.7%, a third above label. Same category, same purchase year, three different stories.
Scope for this guide: DSID vitamin, mineral, and omega-3 categories. Not your bottle. Not botanicals beyond DSID’s limited green tea pilot. When you need batch-level verification, independent product testing still matters. See our third-party certification guide for that layer.
What DSID is (and is not)
DSID is a joint NIH Office of Dietary Supplements and USDA program built primarily for population nutrition research: linking supplement intake to NHANES survey data and estimating what Americans actually consume from pills, not just what labels claim.[1][2] Shoppers borrow that infrastructure for a different purpose: a category-level read on whether labels and lab measurements tend to agree.
The mechanics follow from that goal. Researchers purchase products using category-specific U.S. sampling, test multiple production lots in analytical laboratories, and use regression analysis to estimate how labeled amounts compare with measured content across a category. A product that declares 200 mcg selenium and one that declares 55 mcg both feed the same model. DSID then predicts what a category-average product would contain at each standard label level.
After testing multiple lots per product, DSID fits a regression model. The figure you see at, say, 400 mcg folic acid on the label is the model’s predicted category mean — not an unweighted average of the bottles in the study.
That distinction is easy to miss and easy to misquote. A simple average of every bottle DSID bought would give one number per ingredient. The regression adjusts for which products entered the sample, which label levels they declared, and how individual lots varied, then predicts content at the label levels researchers need for intake modeling. Standard errors in DSID Table 2[2] tell you how tight or loose that prediction is. They are not the same thing as “your product might be off by X%.”
Those layers stack rather than compete. DSID answers a population question: for this category and label level, what did the sampled market look like in the lab? Independent testing answers a batch question: did this product lot pass defined checks?
| Layer | Question | Example |
|---|---|---|
| DSID | How closely did lab measurements match labeled amounts in this category? | DSID-4 adult MVM category 05 |
| Dose registry | Does typical shelf dose reach trial floors? | Clinical dose registry |
| Independent testing | Did this product or batch pass defined checks? | NSF Certified, USP Verified, ConsumerLab review |
| DSID can answer | DSID cannot answer |
|---|---|
| Category-level predicted content at a stated label level | Whether your specific bottle or lot matches its panel |
| How a sampled U.S. category behaved in the lab | Clinical benefit, fraud, or batch pass/fail |
| Direction and magnitude of label-to-lab gaps by nutrient | Which mechanism caused a deviation for one product |
| Inputs for population intake modeling | Most botanicals and newer longevity compounds |
NSF certification, USP Verified, and ConsumerLab sit in different program buckets. Our certification guide explains the distinctions. Do not flatten them into one generic “certified” label.
How the study works
The regression picture above lives inside a larger study design. Here is what matters when you read the tables rather than the documentation cover page.
Open DSID Table 2 and you will not find a product list. You get category estimates instead: one row per ingredient and label level, built from lab runs NIH already commissioned. That Excel snapshot is what we verified for this guide.
For adult multivitamins, NIH ran the category twice, tied to different NHANES cycles. Category 01 covers products purchased in 2006–07; category 05 covers products purchased in 2011–12 (listed as Adult MVM-2017 in DSID documentation).[2] Children’s MVM, non-prescription prenatal MVM, and omega-3 fatty acid categories use separate study codes. Do not stitch round 01 folic acid next to round 05 selenium and call it a trend. The purchase years, formulas, and sampling frames differ even when the declared label amount matches.
Each Table 2 row carries three numbers worth knowing: predicted mean amount per serving, percent difference from label, and a standard error of the predicted mean (SEM). Think of the SEM as how much that category estimate might shift if researchers repeated the sampling. A narrow SEM means confidence in the category number, not confidence about your bottle. DSID-4 also adds first-time validated estimates for vitamin D, vitamin A, and chromium in adult MVMs, plus a green tea botanical pilot.[1]
Cross-nutrient comparisons still deserve skepticism. Selenium and vitamin C in the same table were measured with different assays; vitamin D may appear in IU or mcg depending on the row. DSID documents the method per ingredient. We cite Table 2 as published rather than pretending those pipelines are interchangeable.
| Stage | Example | What it proves |
|---|---|---|
| Label | 400 mcg folic acid declared | What the panel states |
| Lab (DSID) | 494 mcg regression-derived estimate | Category-level predicted content, not one bottle |
| Trial | Outcome-specific trial dose (see dose registry) | What human trials used for a given outcome |
| Takeaway | — | Accurate label ≠ clinically sufficient dose |
Because funding is governmental, DSID is not industry-funded analytical marketing. That matters when a brand cites “lab tested” on the front and you want population context that did not come from the brand’s contract lab.
What the data show
With that framing in place, we tested two editorial priors against DSID-4 Table 2 for adult MVM category 05. For each analyte, we selected the middle label level among those DSID publishes in Table 2 for that ingredient in category 05. Before writing, we registered two guesses about what the data would show; the numbers below are what came back.
PRIOR-01A asked whether overage (estimate above label) would be more common than shortfall. Result: hit. At the label levels we selected, nineteen of 21 analytes showed positive percent difference from label; two showed shortfall (magnesium and thiamin). In plain terms: when DSID looked at adult MVMs bought in 2011–12, the typical pattern at those label levels was “a bit more than the label says,” not “a bit less,” with magnesium and thiamin as the exceptions.
PRIOR-01B asked whether minerals would show a larger absolute deviation from labeled amounts than vitamins. Result: miss. Median absolute percentage deviation from label was 8.1% for minerals and 12.1% for vitamins at those label levels. We expected minerals to drift further from label; vitamins did. The gap is real either way, but the ranking we guessed was wrong.
That is the point of filing priors before writing. The data get a vote.
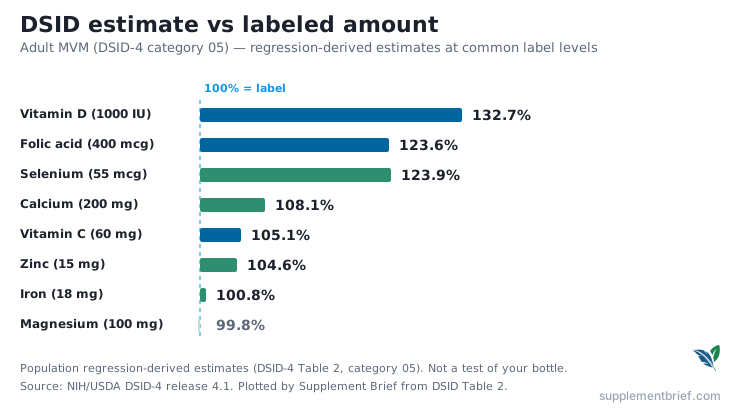
DSID estimates are for population studies, not to assess content in a specific product. Values are regression-derived category estimates with standard errors documented in DSID Table 2.
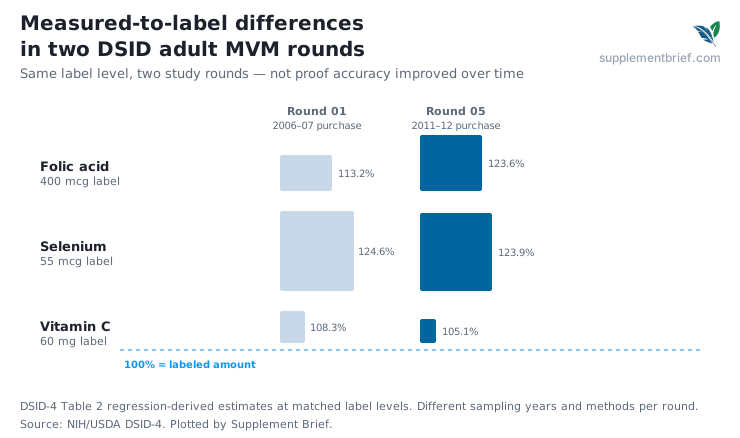
At matched label levels, adult MVM round 01 (2006–07 purchase) and round 05 (2011–12 purchase) can diverge: same nutrient, same declared label amount, different estimated lab content. Folic acid at a 400 mcg label rose from an estimated 113.2% of labeled in round 01 to 123.6% in round 05. Selenium at 55 mcg was essentially flat (124.6% vs 123.9%). Vitamin C at 60 mg moved from 108.3% to 105.1%. That is not proof the market “got more accurate.” Different purchase years, formulas, and sampling frames sit underneath those curves.
Children’s MVM folic acid is the worked example in DSID’s own documentation, useful because it shows how one category slice gets reported. At a 400 mcg label level (category 02, ages 4 years and older), DSID’s regression-derived estimate is 470 mcg per serving (SEM ± 15 mcg), about 117.5% of labeled.[1] Compare that to adult MVM category 05 at the same 400 mcg label: 123.6% of labeled. Same declared amount on the panel, different category, different estimate. Neither number is your child’s gummy.
| Nutrient | Category | Label (baseline) | DSID estimate (% of labeled) | Signed deviation | SEM | Purchase cohort |
|---|---|---|---|---|---|---|
| Folic acid | Adult MVM 05 | 400 mcg | 123.6% | +23.6% | ±7.6 mcg | 2011–12 |
| Vitamin D | Adult MVM 05 | 1000 IU | 132.7% | +32.7% | ±18.4 IU | 2011–12 |
| Selenium | Adult MVM 05 | 55 mcg | 123.9% | +23.9% | ±0.9 mcg | 2011–12 |
| Iron | Adult MVM 05 | 18 mg | 100.8% | +0.8% | ±0.3 mg | 2011–12 |
| Magnesium | Adult MVM 05 | 100 mg | 99.8% | −0.2% | ±1.4 mg | 2011–12 |
| Folic acid | Children’s MVM 02 | 400 mcg | 117.5% | +17.5% | ±15 mcg | per DSID-4 |
Practical takeaway
Read DSID numbers as category behavior at a stated label level, with SEM bars, not as a verdict on the bottle in your cabinet. Direction and magnitude change by nutrient.
See all 21 nutrients DSID reports for adult MVM category 05
Each row is DSID Table 2’s middle label tier for that analyte in adult MVM category 05 (2011–12 purchase cohort). Prose examples and charts above often cite a different Table 2 tier for the same nutrient — DSID publishes many label levels per analyte — so label amounts here may not match a worked example even when the percent-of-label estimate is similar. Tap a nutrient to compare label amount, DSID estimate, deviation, and SEM.
NIH DSID adult multivitamin/mineral category 05 (2011–12 purchase cohort): regression-derived estimates for 21 nutrients at middle label levels range from 96.5% to 140.8% of labeled amounts in DSID Table 2.
| Nutrient | Type | Label | DSID estimate (% of label) | Signed deviation | SEM | Purchase cohort |
|---|---|---|---|---|---|---|
| Calcium | Mineral | 118 mg | 108.1% | +8.1% | ±2.3 mg | 2011-12 |
| Chromium | Mineral | 67 mcg | 124.7% | +24.7% | ±1.4 mcg | 2011-12 |
| Copper | Mineral | 0.9 mg | 112.2% | +12.2% | ±0.02 mg | 2011-12 |
| Folic acid | Vitamin | 240 mcg | 122.8% | +22.8% | ±7.5 mcg | 2011-12 |
| Iodine | Mineral | 90 mcg | 120.1% | +20.1% | ±2.5 mcg | 2011-12 |
| Iron | Mineral | 5.79 mg | 100.8% | +0.8% | ±0.09 mg | 2011-12 |
| Magnesium | Mineral | 93 mg | 99.8% | -0.2% | ±1.3 mg | 2011-12 |
| Manganese | Mineral | 2 mg | 107.4% | +7.4% | ±0.02 mg | 2011-12 |
| Niacin | Vitamin | 30 mg | 104.5% | +4.5% | ±0.29 mg | 2011-12 |
| Phosphorus | Mineral | 60 mg | 108.3% | +8.3% | ±1.1 mg | 2011-12 |
| Potassium | Mineral | 75 mg | 101.8% | +1.8% | ±0.42 mg | 2011-12 |
| Riboflavin | Vitamin | 5.1 mg | 114.8% | +14.8% | ±0.11 mg | 2011-12 |
| Selenium | Mineral | 67 mcg | 123% | +23% | ±1 mcg | 2011-12 |
| Thiamin | Vitamin | 6.67 mg | 96.5% | -3.5% | ±0.07 mg | 2011-12 |
| Vitamin A | Vitamin | 4945 IU | 114.8% | +14.8% | ±142.1 IU | 2011-12 |
| Vitamin B-12 | Vitamin | 30 mcg | 121.8% | +21.8% | ±0.77 mcg | 2011-12 |
| Vitamin B-6 | Vitamin | 8 mg | 109.1% | +9.1% | ±0.12 mg | 2011-12 |
| Vitamin C | Vitamin | 152 mg | 105.1% | +5.1% | ±2.1 mg | 2011-12 |
| Vitamin D | Vitamin | 384 IU | 140.8% | +40.8% | ±5.5 IU | 2011-12 |
| Vitamin E | Vitamin | 67 IU | 109.4% | +9.4% | ±1.3 IU | 2011-12 |
| Zinc | Mineral | 11 mg | 105.9% | +5.9% | ±0.08 mg | 2011-12 |
DSID estimates are for population studies, not to assess content in a specific product. Values are regression-derived category estimates with standard errors documented in DSID Table 2. Label amounts here are DSID’s middle published tier per analyte; prose examples above may cite a different Table 2 tier for the same nutrient.
Calcium(Ca)
DSID estimates are for population studies, not to assess content in a specific product. Values are regression-derived category estimates with standard errors documented in DSID Table 2.
Why labels drift from lab results
The DSID numbers above describe gaps. They do not, by themselves, tell you why a gap exists, and a gap is not automatically fraud. Three stages sit between what you read on Supplement Facts and what a lab reports:
- Declared label amount — what Supplement Facts state.
- Amount at manufacture — formulation choices, intentional overage buffers, lot-to-lot variation.
- Amount measured at test — what DSID laboratories analyzed in sampled products from multiple lots.
Between those stages you can get formulation overage, shelf degradation, analytical recovery differences, sampling variance, and batch-to-batch spread. DSID tested multiple production lots per product, so lot-to-lot variation is part of why category estimates carry uncertainty, not only differences between brands.[1]
Manufacturers may formulate above declared label amounts. FDA dietary supplement cGMP rules require the master manufacturing record to include a statement of any intentional overage amount of a dietary ingredient when used.[5] Intentional overage is one possible manufacturing explanation among degradation, blending variance, and sampling error. DSID reports category-level correlation; manufacturing intent and product-level mechanism stay outside its scope.
Shortfall can reflect raw-material variability, blending, degradation, sampling, or analytical method limitations. The same boundary applies.
Two kinds of uncertainty get conflated in casual talk about “lab error.” Analytical measurement uncertainty comes from method limits, matrix effects, and recovery in HPLC, LC-MS, and related assays. Category estimate uncertainty comes from the SEM around the regression-derived mean in DSID Table 2. The two are separate sources of error, and DSID figures only report the second. The SEM is not a confidence interval and should not be read as a plausible range for an individual bottle.
How to use this when shopping
Use DSID for category skepticism, not a brand blacklist. The dataset describes how a nutrient class behaved in a sampled U.S. market slice at a given label level. That says nothing about whether your 2026 SKU still matches its panel.
Pair DSID with tools that answer adjacent questions:
| Your question | Layer |
|---|---|
| What is on the market? | Label / DSLD shelf context |
| Does this category match its label on average? | DSID |
| Does shelf dose match trial floors? | Dose registry |
| What is in my bottle? | Independent product testing |
| Does it work for my outcome? | Clinical evidence in condition guides |
Even when a label is accurate, the dose may still sit below what human trials used. Even when DSID shows category overage, the product may still be irrelevant to your goal. Label, lab, and trial are separate layers.
Where it lands
Category overage + label dose + stacking = a risk check for nutrients with established tolerable upper intake levels (ULs), not a reason to panic about every multivitamin. Step 1: note whether DSID shows historical overage for your product category (adult MVM, prenatal MVM, and so on). Step 2: read your label for vitamins A, D, and E and for iron, which have U.S. ULs. Step 3: if one product already delivers a large fraction of a UL and you stack fortified foods or other supplements, map total intake before adding another bottle. Step 4: a modest category overage does not by itself establish a safety problem; risk depends on the nutrient, dose, form, total intake, and whether a UL exists.
Independent product testing remains the path when you need batch verification, especially for botanicals where DSID has no population lab-vs-label panel.
Limits and gaps
Data vintage: DSID-4 adult MVM category 05 reflects products purchased in 2011–12. Some mechanisms that can produce label-to-content differences, such as raw-material variability and shelf-life degradation, are not unique to 2011. But DSID-4 cannot tell us how frequently those deviations occur in products sold in 2026. We treat DSID as structural category behavior, not a 2026 SKU audit. When 2006–07 and 2011–12 rounds diverge on a nutrient, we report it rather than hand-waving “still valid.”
Botanical vacuum: DSID primarily covers vitamins, minerals, and omega-3s, plus a limited green tea pilot. Comparable population-level lab-vs-label estimates are missing for most botanicals and newer longevity compounds such as ashwagandha, rhodiola, ginseng, NMN, or urolithin A. For those categories, independent identity and potency testing is the shelf-level verification path. See third-party certification, urolithin A vs NMN, or Panax ginseng for ED for how we handle botanical evidence elsewhere.
Other limits: US market categories only; DSID categories exclude most specialty products; estimates apply only at label levels represented in DSID tables; DSID is linked to NHANES cycles and is built for population intake modeling as much as for shopper audits. Under DSHEA, supplements reach the market without FDA pre-approval; manufacturers remain responsible for what the label states.[4]
ODS disclaimer (repeat): population estimates only. See the scope table in the opening section and the note under Figure 1.
FAQ
Can DSID tell me if my multivitamin is accurate?
No. DSID reports regression-derived category estimates at specific label levels: a population read, not a score for the bottle on your counter. For that, you need independent product testing of your lot or a published review that included your SKU.
Is it better to buy third-party tested instead of relying on DSID?
They solve different problems. DSID tells you how a category behaved in a sampled market. Independent testing tells you whether a specific product batch met defined checks. Use DSID for category context; use named certifiers or published test results when you need batch proof.
What's the difference between DSID and ConsumerLab?
Think population database versus product review. DSID regresses nationally representative category samples into label-level estimates. ConsumerLab buys specific SKUs, tests them, and publishes product-specific results against its quality criteria. Same topic (label versus lab), different grain size.
Why do labels overstate or understate ingredients?
Many reasons, often overlapping: formulation buffers, degradation over shelf life, blending variance, raw material quality, analytical recovery differences, and lot-to-lot spread. DSID measures the gap at category level; pinning down one mechanism for one product takes a different kind of evidence.
Does overage mean I should worry about toxicity?
Not automatically. A DSID category estimate above the labeled amount does not establish that a particular product contains the same overage or that the intake is unsafe. Whether excess intake matters depends on the nutrient, total intake, form, and whether a UL has been established. For nutrients with ULs, map total intake across supplements and fortified foods rather than stopping supplements based on a DSID category estimate alone. UL tables: NIH ODS nutrient recommendations.[3]
What you should take away
Known: DSID publishes regression-derived category estimates with SEMs; overage is more common than shortfall in adult MVM category 05 at the label levels we selected; magnitude varies sharply by nutrient; independent testing, DSID, and the dose registry answer different questions.
Unknown: your specific bottle; post-2012 formula drift for every SKU; botanicals and newer longevity compounds outside DSID coverage.
Evidence ends at population regression, before clinical benefit, fraud, or batch-failure claims.
Reasonable way to use it: treat DSID as background when reading labels, stacking UL nutrients, or deciding whether category-level overage makes independent testing worth paying for on top of a label checklist.
What not to use it for: treating DSID as a product grade; ignoring UL stacking because “it’s just a multivitamin”; expecting DSID data for ashwagandha or NMN.
Clinician questions: “Given my prenatal, iron, and vitamin D, am I approaching any UL?” Not “which brand failed DSID.”
Bottom line
A label can be accurate and still not prove efficacy. A label can be inaccurate without proving fraud. A product can match its label and still sit below trial doses. The useful question is not whether supplements are "accurate." It is which layer of evidence answers the question you actually have.
How this article was researched
Evidence base: DSID-4 combined data files (Table 2 predicted ingredient amounts) and DSID-4 data files documentation.[1][2] All numeric claims trace to DSID Table 2 or the applications section of the documentation PDF. Values were verified against the DSID release 4.1 Excel snapshot DSID4CombinedDataFiles.xlsx (Table 2 sheet), downloaded 13 August 2026.
Editorial priors (PRIOR-01A and PRIOR-01B) were registered before analysis and tested against the middle label level per analyte in adult MVM category 05, as listed in DSID Table 2. Selected label levels and prior metrics match the interactive 21-nutrient explorer in this guide. Results are reported separately.
Research date: August 2026. Update when DSID-5 releases or when DSID-4 files are revised.
Sources
-
NIH Office of Dietary Supplements / USDA. Dietary Supplement Ingredient Database (DSID) release 4.1 — data files documentation and applications guidance. ods.od.nih.gov. Accessed August 2026.
-
NIH Office of Dietary Supplements / USDA. DSID-4 Table 2 predicted ingredient amounts (combined data files). dsid.od.nih.gov. Accessed August 2026.
-
NIH Office of Dietary Supplements. Nutrient recommendations and tolerable upper intake levels. ods.od.nih.gov. Accessed August 2026.
-
U.S. Food and Drug Administration. Dietary Supplement Health and Education Act of 1994 (DSHEA) overview. fda.gov. Accessed August 2026.
-
U.S. Food and Drug Administration. 21 CFR § 111.210 — master manufacturing record requirements, including intentional overage. ecfr.gov. Accessed August 2026.